CloudWatch Logs are often the go-to choice for visualizing logs from AWS Lambda functions or ECS services. They’re easy to set up, tightly integrated with AWS, and work well when traffic is low to moderate.
But have you ever paused to think about what happens when your system starts handling hundreds or thousands of requests per second?
At scale, CloudWatch Logs can quietly turn into one of the most expensive line items on your AWS bill.
Why CloudWatch Logging Gets Expensive
In high-throughput systems, logging isn’t just about writing text. You’re paying for:
- Log ingestion (per GB)
- Log storage (per GB per month)
- Log retrieval and insights queries
As traffic grows, even “small” log statements like request IDs, payloads, debug messages add up alarmingly fast.
The Common Cost-Control Strategies (and Their Trade-offs)
To control CloudWatch costs, teams usually fall back on two options:
1. Minimize Logs Emitted by Lambda or ECS
You reduce log volume by removing debug logs, request/response logs, or detailed traces.
Trade-off:
When something breaks in production, you suddenly don’t have enough context to debug the issue. Reproducing rare edge cases becomes painful or even impossible.
2. Reduce the Log Retention Period
Instead of storing logs for months, you keep them for a few days or weeks.
Trade-off:
Once logs expire, they’re gone forever. This makes:
- Root-cause analysis of older incidents impossible
- Audits and compliance checks harder
- Trend analysis across time unreliable
The Core Dilemma
Typically, you’re forced to choose between good observability or reasonable costs.
For mature, large-scale systems, neither compromise is acceptable.
But, what if you could emit rich meaningful logs, while storing them for a longer duration, AND keep costs under control? Is there a way to decouple log generation, log storage, and log querying without losing visibility?
Logs to S3: The Cost-Effective Alternative
We all know that Amazon S3 is one of AWS’s best offerings when it comes to large-scale, long-term data storage. It’s durable, highly available, and most importantly, cheap at scale.
So the obvious question arises:
If S3 is so good at storing large volumes of data for long periods, why not store logs there?
Because yes! It absolutely works. But like everything in distributed systems, it comes with its own set of challenges.
The Hidden Challenges of Logging Directly to S3
While S3 is an excellent destination, simply deciding to store logs there doesn’t magically solve all problems.
Here are the two biggest questions you immediately run into:
1. How do you move logs from Lambda to S3 without first going through CloudWatch?
If logs hit CloudWatch Logs first, you’ve already paid the ingestion cost (which defeats the entire purpose of cost optimization).
2. How do you query logs efficiently when debugging?
When an incident occurs, you often need to filter logs by:
- Date or time range
- Lambda function or service name
- Specific request IDs or error patterns
S3 is object storage, not a query engine, so how do you debug without CloudWatch’s UI?
Fortunately, AWS Has an Answer
AWS now provides a way to stream CloudWatch Logs directly to S3 using Log Subscription Filters.
With subscription filters, logs can be shipped in near real time from CloudWatch Logs to destinations like Amazon S3, Amazon Kinesis Data Streams, and Amazon Kinesis Firehose
This allows you to:
- Keep CloudWatch retention minimal (or near zero)
- Offload long-term storage to S3
- Dramatically reduce logging costs
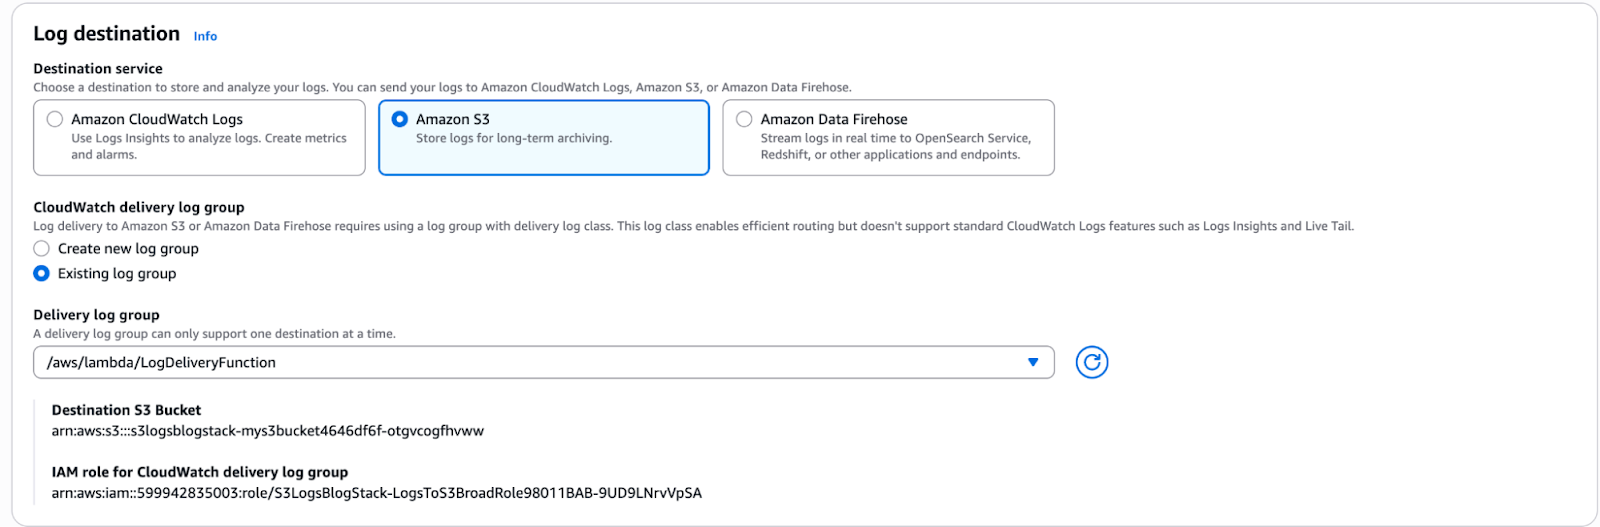
How to Enable Directly from Console:
Lambda -> Configuration -> Monitoring&Observability -> Log Destination
The Catch: Infrastructure as Code Pain
While this feature works well, there’s an important limitation worth calling out.
Subscription filters for direct S3 delivery are easy to configure via the AWS Console, but are not straightforward to set up using CDK, Serverless Framework (SLS), or SAM.
This becomes a real issue for teams that:
- Enforce infrastructure as code
- Avoid manual console changes
- Want reproducible environments across stages
In practice, this often means: custom resources, additional IAM complexity, or workarounds using Firehose instead of direct S3 delivery.
Querying Logs: Athena to the Rescue
Now comes the second problem; how do you actually view and query logs stored in S3?"
This is where Amazon Athena shines by:
- Defining Glue tables
- Structuring S3 paths intelligently (for example, by date and Lambda name)
You can query logs using plain SQL which can filter by date ranges, search specific Lambda functions, drill into error patterns during debugging, and perform historical analysis months later. All without paying CloudWatch Logs query costs!
The Bigger Picture
By combining:
- Minimal CloudWatch retention
- Log subscription filters
- S3 for long-term storage
- Athena + Glue for querying
You get the best of both worlds: detailed logs, long retention, and significantly lower costs.
Let’s Dive into the CDK Implementation
Without any further theory, let’s get our hands dirty and look at how this can be implemented using AWS CDK.
Before we jump into the code, let’s clearly understand what components we need and why they matter.
Components Required
To build this pipeline, we’ll need the following:
- S3 Bucket: This will act as the long-term storage layer for our logs.
- CloudWatch Log Group (DELIVERY class): A lightweight log group optimized for log delivery use cases.
- Subscription Filter: Used to stream logs from CloudWatch to S3.
- Lambda Function: The source of the logs.
Why Use a DELIVERY Class Log Group?
At first glance, you might wonder, "Why not just use a standard CloudWatch Log Group?"
This is where DELIVERY class log groups come into play.
DELIVERY class log groups are a special type of CloudWatch Log Group designed specifically for log delivery pipelines. They intentionally strip away many of the features that make standard log groups expensive, such as advanced querying, long retention, and insights-related capabilities
What makes them valuable is that they offer very low cost with a fixed retention of 1 day. This optimizes through output for streaming logs elsewhere.
Because logs live here only temporarily before being shipped to S3, this limitation is perfectly acceptable and actually what you want.
In practice, a DELIVERY class log group costs a fraction of what a standard log group would, making it ideal for high-throughput Lambda or ECS workloads.
Think of it as a buffer, not a storage solution.
Implementing the Pattern Using AWS CDK
For this walkthrough, we’ll be using AWS CDK, but it’s worth calling out upfront that the same architectural pattern applies to Serverless Framework (SLS) and AWS SAM as well. Only the syntax changes, the core idea remains the same.
Key Detail: Log Group Must Be Created Before the Lambda
When working with DELIVERY class log groups, there’s an important constraint you need to be aware of.
The CloudWatch Log Group must be created before the Lambda function, and it should ideally follow the default Lambda log group naming convention:
/aws/lambda/<function_name>
Why Use the Default Log Group Name?
Lambda automatically looks for a log group with this exact name.
If it already exists, Lambda will attach itself to it instead of creating a new one, which is important because:
- Lambda cannot create DELIVERY class log groups on its own
- If the log group doesn’t exist, Lambda will attempt to create a STANDARD log group, defeating the whole purpose
By pre-creating the log group with the correct name and class, we ensure:
- Lambda uses the DELIVERY class log group
- No accidental STANDARD log groups are created
- Costs remain under control
Step 1: Create the DELIVERY Class Log Group
Since DELIVERY class log groups are not yet supported by the L2 construct, we use the L1 CfnLogGroup construct.
const logGroup = new logs.CfnLogGroup(this, 'LambdaLogGroupDelivery', {
  logGroupName: `/aws/lambda/${functionName}`,
  logGroupClass: 'DELIVERY',
});
Next, we create an L2-compatible interface so it can be attached to the Lambda construct:
const logGroupInterface = logs.LogGroup.fromLogGroupName(
  this,
  'L2LogGroupBridge',
  logGroup.logGroupName!
);
Think of this as a bridge between L1 and L2 constructs.
Step 2: Create the Lambda Function
Now we define the Lambda function and explicitly attach the pre-created log group.
const myLambda = new NodejsFunction(this, 'MyLambda', {
  functionName: functionName,
  runtime: lambda.Runtime.NODEJS_20_X,
  handler: 'handler',
  entry: 'src/handler/index.ts',
  logGroup: logGroupInterface,
  loggingFormat: lambda.LoggingFormat.JSON,
});
Key points here:
- The functionName matches the log group name
- The logGroup property ensures Lambda does not create its own log group
- JSON logging makes downstream querying with Athena much easier
Step 3: Create the S3 Bucket and Subscription Filter
Next, we define the S3 bucket that will store our logs long-term.
const s3Bucket = new s3.Bucket(this, 'MyS3Bucket', {
  removalPolicy: cdk.RemovalPolicy.DESTROY,
});
Then we wire up a CloudWatch Logs Subscription Filter to stream logs directly to S3.
const subscriptionFilter = new logs.CfnSubscriptionFilter(
  this,
  'LogsToS3Bucket',
  {
    logGroupName: logGroup.logGroupName!,
    filterPattern: '',
    destinationArn: s3Bucket.bucketArn,
    roleArn: logsToS3Role.roleArn,
  }
);
A few things to note:
- An empty filterPattern means all logs are forwarded
- The IAM role (logsToS3Role) must allow CloudWatch Logs to write to S3
- This setup effectively turns the DELIVERY log group into a temporary buffer
What Happens After Deployment?
Once the stack is deployed, CloudWatch Logs performs a connectivity test by sending a sample log event to the destination S3 bucket.
You’ll see an object created at a path similar to:
s3://<S3-Bucket>/AWSLogs/<ACCOUNT_ID>/us-east-1/
AWSLogs-DeliveryTest-<hash>
This confirms:
- The subscription filter is working
- Permissions are correctly configured
- Logs can be delivered successfully to S3
Reference Implementation
For the complete setup, including IAM roles, Glue tables, and Athena queries—please refer to the GitHub repository.
With this in place, you now have:
- Minimal CloudWatch retention
- Ultra-low-cost DELIVERY class log groups
- Long-term, queryable logs in S3
- A setup that scales cleanly with traffic

Test our Deployment:
1. First we check if our log group is properly configured with Log Class as Delivery.

2. Lets see if running our lambda actually sends the log to s3 or not.
a. Running lambda:

b. S3 Bucket:
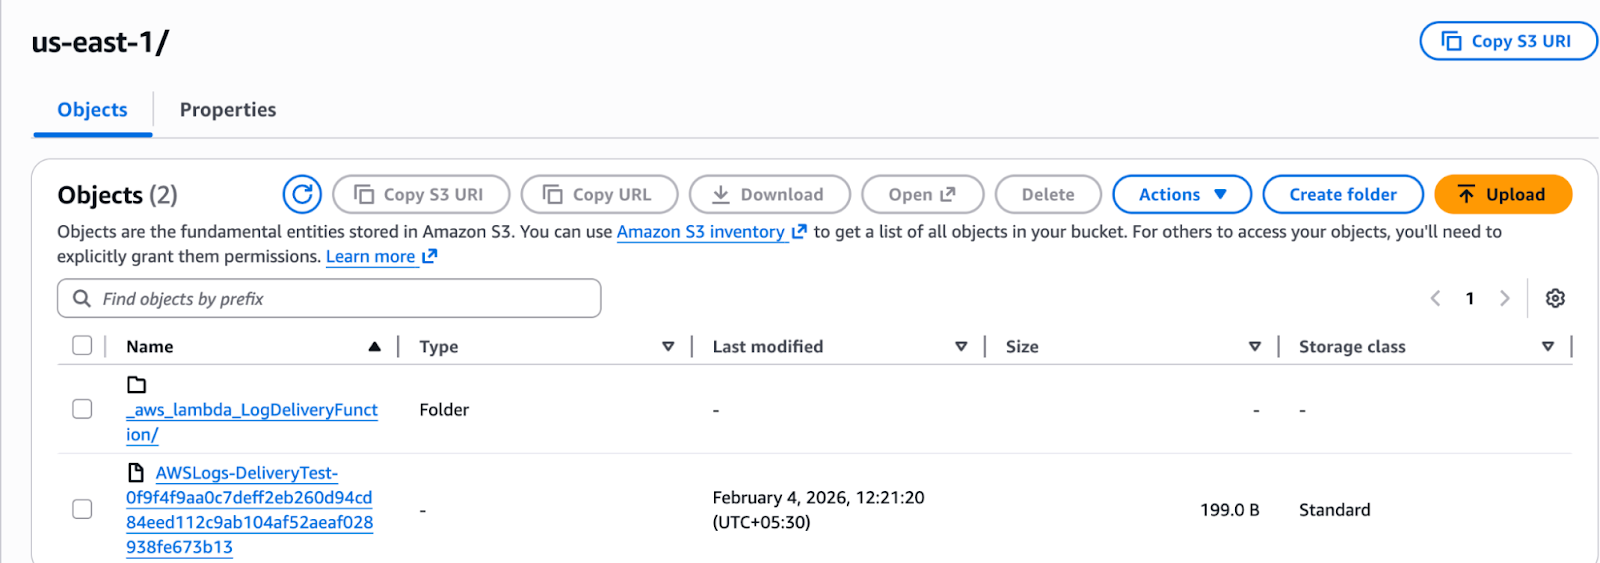
3. As you can see we got the lambda name folder and that folder should contain the logs.
c. Logs Folder:
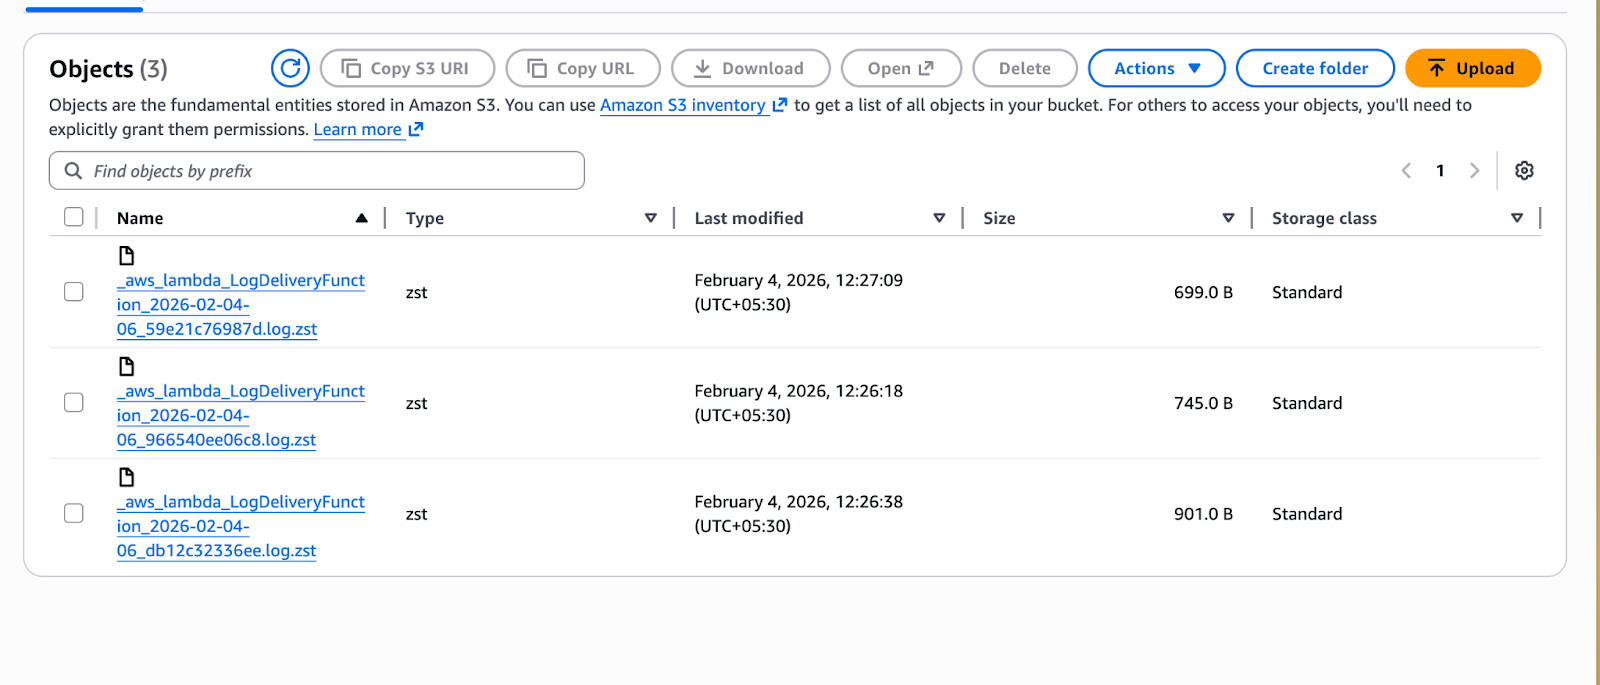
4. As you can see the logs are stored in the bucket, it gets stored in the folder structure <lambda function name>/<year>/<month>/<day>/<hour>
How Do We Visualize These Logs?
At this point, a natural question comes up:
If the logs are sitting in S3 as compressed files, how do we actually view or debug them?
When you inspect the S3 bucket, you’ll notice that the log files are gzipped and organized in a structured folder hierarchy. At first glance, this might feel like a drawback.
The Manual Option (But Not the Best One)
One approach could be to trigger a Lambda on S3 upload, unzip the log file, and then store them back in the same folder structure.
While this works, it adds operational overhead which complicates an otherwise clean pipeline with additional Lambda execution costs.
Thankfully, we don’t need to do any of this.
Athena to the Rescue (Again)
The good news is that Amazon Athena natively supports querying compressed log files delivered by CloudWatch Logs which means NO manual decompression, NO preprocessing Lambda, and NO format conversion.
Athena can query these logs out of the box!
What Makes Athena Powerful Here?
Once the logs are cataloged using AWS Glue, Athena allows you to query logs using SQL.
You can filter by:
- Year
- Month
- Day
- Hour
You can search by:
- Lambda function
- Log level
- Error messages
- Request IDs
The querying experience is surprisingly close to what you’d expect from CloudWatch Logs Insights, but at a fraction of the cost.
Conclusion
Direct log streaming to Amazon S3 represents a significant shift in how we manage observability data. While it is a relatively nascent feature lacking native support in Infrastructure as Code (IaC) frameworks like CDK, Serverless, or SAM (at the time of writing) the benefits are difficult to ignore.
By bypassing the standard CloudWatch ingestion path, organizations can achieve substantial cost savings while maintaining the ability to query long-term data via Athena and trigger custom alarms. For now, the setup may require a manual touch or custom scripts, but the trade-off in architectural efficiency and retention flexibility makes it a compelling choice for any high-volume production environment.
What’s Next?
Setting up Athena tables, defining partitions, and writing efficient queries is a topic deserving its own deep dive.
That’s why we’ll cover how to query these logs using Athena in a separate blog.
We’ll look at:
- Glue table definitions
- Partition strategies
- Sample debugging queries
- Performance and cost optimizations
With this setup, you’ve effectively decoupled log storage from log visualization, preserved rich observability, and avoided the runaway costs of CloudWatch Logs.


%20(1).svg)

.svg)